
In B2B email marketing, we have analyzed plenty of emails sent across the United States in 2020. These marketers sent campaigns to subscribers from all over the world from the US business operating systems. Hence, we compiled an accumulated data with comprehensive resources so that people seeking a study of American industries can get help. They can also have a comparison with how their email marketing campaigns are responding. We have segmented the industries so you can get a detailed insight into the email marketing benchmarks for 2020.
Key Takeaway Notes:
In the United States, marketers have various channels of marketing they work on a daily basis. However, email marketing is one constant mode that remains to be a significant part of how B2B professionals communicate and connect with clients and prospects. At InfoCleanse, our benchmark suggests that while many alterations are witnessed in relation to each industry, we have also seen gradual averages with lesser decreases for specific metrics.
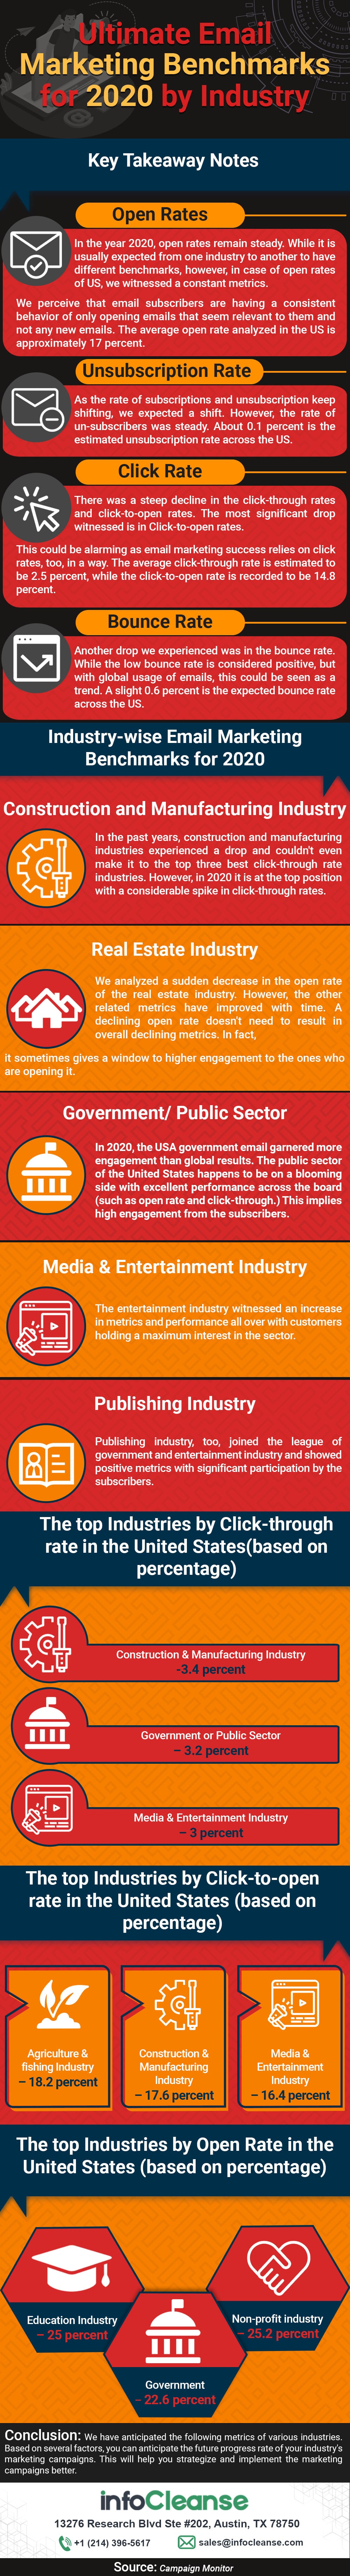
- Open Rates: In the year 2020, open rates remain steady. While it is usually expected from one industry to another to have different benchmarks, however, in case of open rates of US, we witnessed a constant metrics. We perceive that email subscribers are having a consistent behavior of only opening emails that seem relevant to them and not any new emails. The average open rate analyzed in the US is approximately 17 percent.
- Unsubscription Rate: As the rate of subscriptions and unsubscription keep shifting, we expected a shift. However, the rate of un-subscribers was steady. About 0.1 percent is the estimated unsubscription rate across the US.
- Click Rate: There was a steep decline in the click-through rates and click-to-open rates. The most significant drop witnessed is in Click-to-open rates. This could be alarming as email marketing success relies on click rates, too, in a way. The average click-through rate is estimated to be 2.5 percent, while the click-to-open rate is recorded to be 14.8 percent.
- Bounce Rate: Another drop we experienced was in the bounce rate. While the low bounce rate is considered positive, but with global usage of emails, this could be seen as a trend. A slight 0.6 percent is the expected bounce rate across the US.
Industry-wise Email Marketing Benchmarks for 2020:
Construction and Manufacturing Industry: In the past years, construction and manufacturing industries experienced a drop and couldn’t even make it to the top three best click-through rate industries. However, in 2020 it is at the top position with a considerable spike in click-through rates.
Real Estate Industry: We analyzed a sudden decrease in the open rate of the real estate industry. However, the other related metrics have improved with time. A declining open rate doesn’t need to result in overall declining metrics. In fact, it sometimes gives a window to higher engagement to the ones who are opening it.
Government/ Public Sector: In 2020, the USA government email garnered more engagement than global results. The public sector of the United States happens to be on a blooming side with excellent performance across the board (such as open rate and click-through.) This implies high engagement from the subscribers.
Media & Entertainment Industry: The entertainment industry witnessed an increase in metrics and performance all over with customers holding a maximum interest in the sector.
Publishing Industry: Publishing industry, too, joined the league of government and entertainment industry and showed positive metrics with significant participation by the subscribers.
The top Industries by Click-through rate in the United States (based on percentage)
- Construction & Manufacturing Industry – 3.4 percent
- Government or Public Sector – 3.2 percent
- Media & Entertainment Industry – 3 percent
The top Industries by Click-to-open rate in the United States (based on percentage)
- Agriculture & fishing Industry – 18.2 percent
- Construction & Manufacturing Industry – 17.6 percent
- Media & Entertainment Industry – 16.4 percent
The top Industries by Open Rate in the United States (based on percentage)
- Education Industry– 25 percent
- Non-profit industry – 25.2 percent
- Government – 22.6 percent
Concluding Note:
We have anticipated the following metrics of various industries. Based on several factors, you can anticipate the future progress rate of your industry’s marketing campaigns. This will help you strategize and implement the marketing campaigns better.